Wind Ops Copilot
WIND-OPS // Sustaining Energy
Cover
Sustaining Energy · WindOps Initiative

From dashboards
to digital engineers

AI agents that watch every turbine, explain what changed and draft the next step. Built on the SCADA, historian and reporting you already run.

FARM AFARM BFARM CFARM Nth
The fleet

Many wind farms.
One picture.

The data is already flowing from every turbine and every substation. What is missing is a layer that reads it all, continuously.

In place today
SCADAHistorianALGO reportingSAPOEM & budget
Problem statement

Losses are found too late

The fleet produces data every second, but turning it into decisions still depends on manual work. Underperformance is often explained after the energy is lost.

What happens

Alarms, trends and reports are reviewed manually, across separate tools.

Why it matters

Slow drift and repeat faults cost energy before anyone sees them.

What's missing

A layer that reads every signal, continuously, and explains it.

From the original pitch · to be confirmed in discovery
The gap

Data-rich.
Insight-constrained.

SCADA→ Historian→ ALGO→ Engineer→ Email→ Excel→ Meeting→ Action
  • 01Issues surface after the loss.
  • 02No one can read every signal.
  • 03Slow drift hides without an alarm.
Amber steps are manual. Problem statements from the original pitch, to be confirmed in discovery.
Proposed solution

AI agents on your existing data

  1. 01ConnectRead-only links to SCADA, historian, ALGO and SAP.
  2. 02DetectEvery turbine checked against expected output.
  3. 03ExplainProbable cause and impact, in plain English.
  4. 04ActReport, ticket or email drafted. A person approves.
ProposedStarts with Phase 1 · Copilot · 1–2 months
The idea

An AI agent is a digital engineer

  1. 01Understands the goalTargets, budgets and what healthy looks like.
  2. 02Analyses the dataSCADA, alarms, weather and history, together.
  3. 03Decides what mattersSeparates real problems from noise, ranked by impact.
  4. 04Takes the next stepDrafts the report, the ticket, the notification.
  5. 05Works with your toolsTeams, email, Power BI, SAP, the OEM portal.
Illustrative scenario

03:00. Nobody's watching. The agent is.

  1. Wind is normal, but power is low.Output doesn't match the conditions
  2. No alarms. Temperatures normal.Obvious causes ruled out
  3. Yaw error of 9°, on this turbine only.Checked against neighbours in the same wind
  4. Ticket drafted. OEM email ready.By morning the engineer reviews and approves
WTG-14Monitoring
Scenario and figures from the original pitch. Not a real incident.
Inside every turbine

It zooms in where it matters

  1. Rotor bearing running hot.Compared with load-normalised peers
  2. Drive-train vibration trending up.Caught before it becomes an alarm
  3. Blade surface flagged for review.Drone imagery · future option
The +2.85 °C bearing finding comes from SudoGuard's prototype on the open Kelmarsh dataset.
The full vision

Eight specialists.
One evidence trail.

Each agent owns one job. A central orchestrator shares the evidence, controls which tools each agent can use and routes every action to a person for approval.

Already running

A working prototype, today

Built by SudoGuard on the open Kelmarsh wind-farm dataset: six turbines, three years of SCADA. No company data is used.

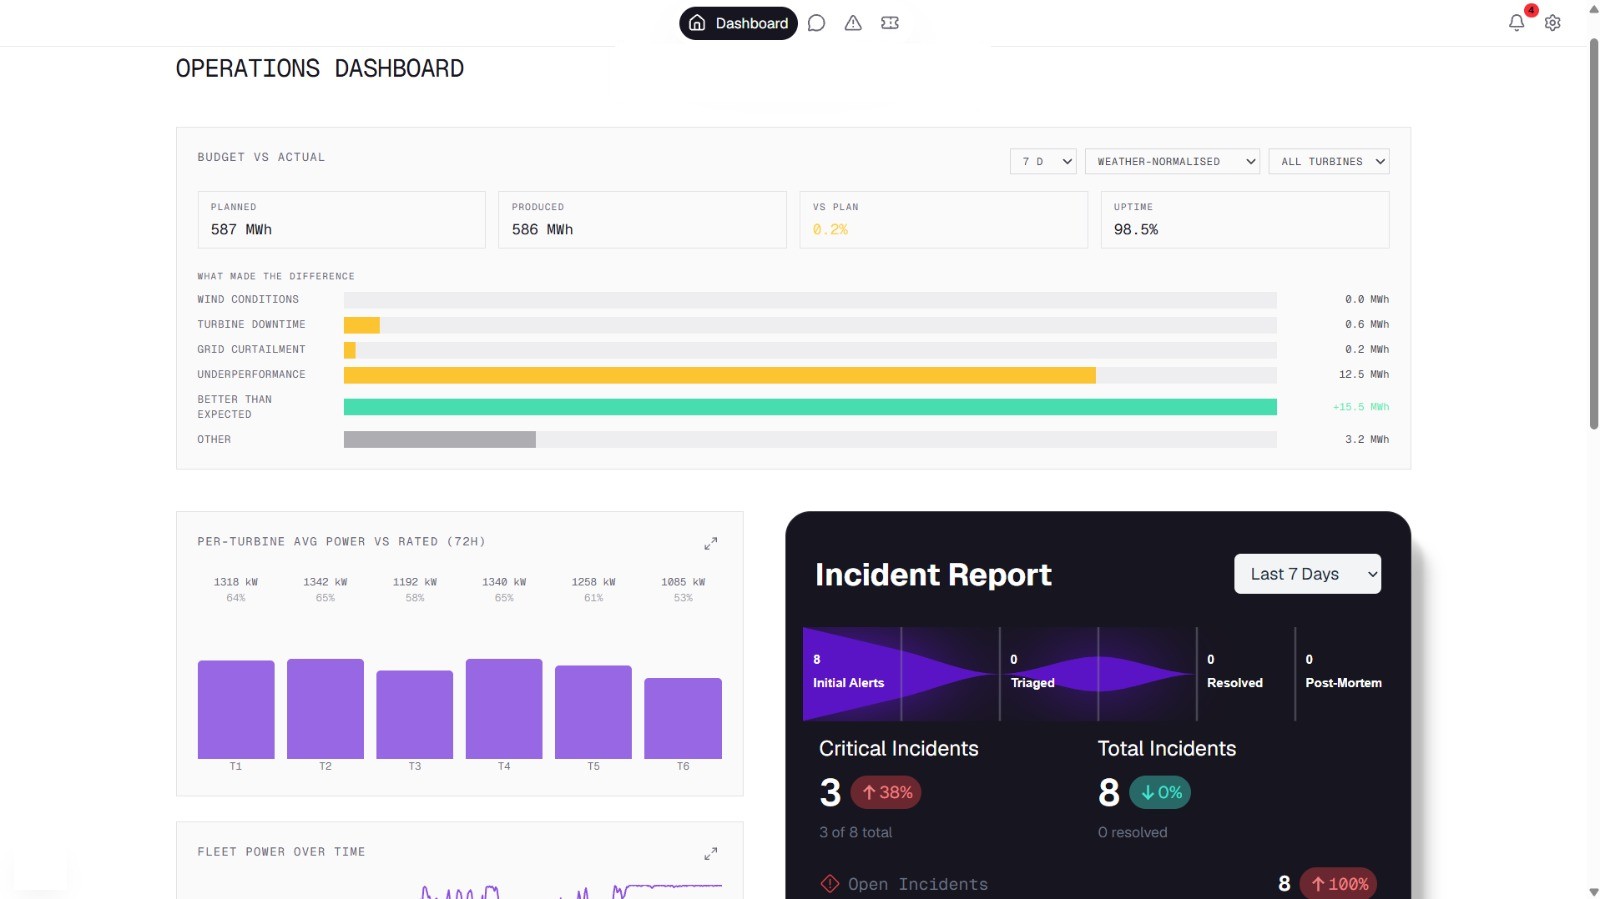
Budget versus actual, and what made the difference.
Prototype operations dashboard showing budget versus actual and per-turbine power
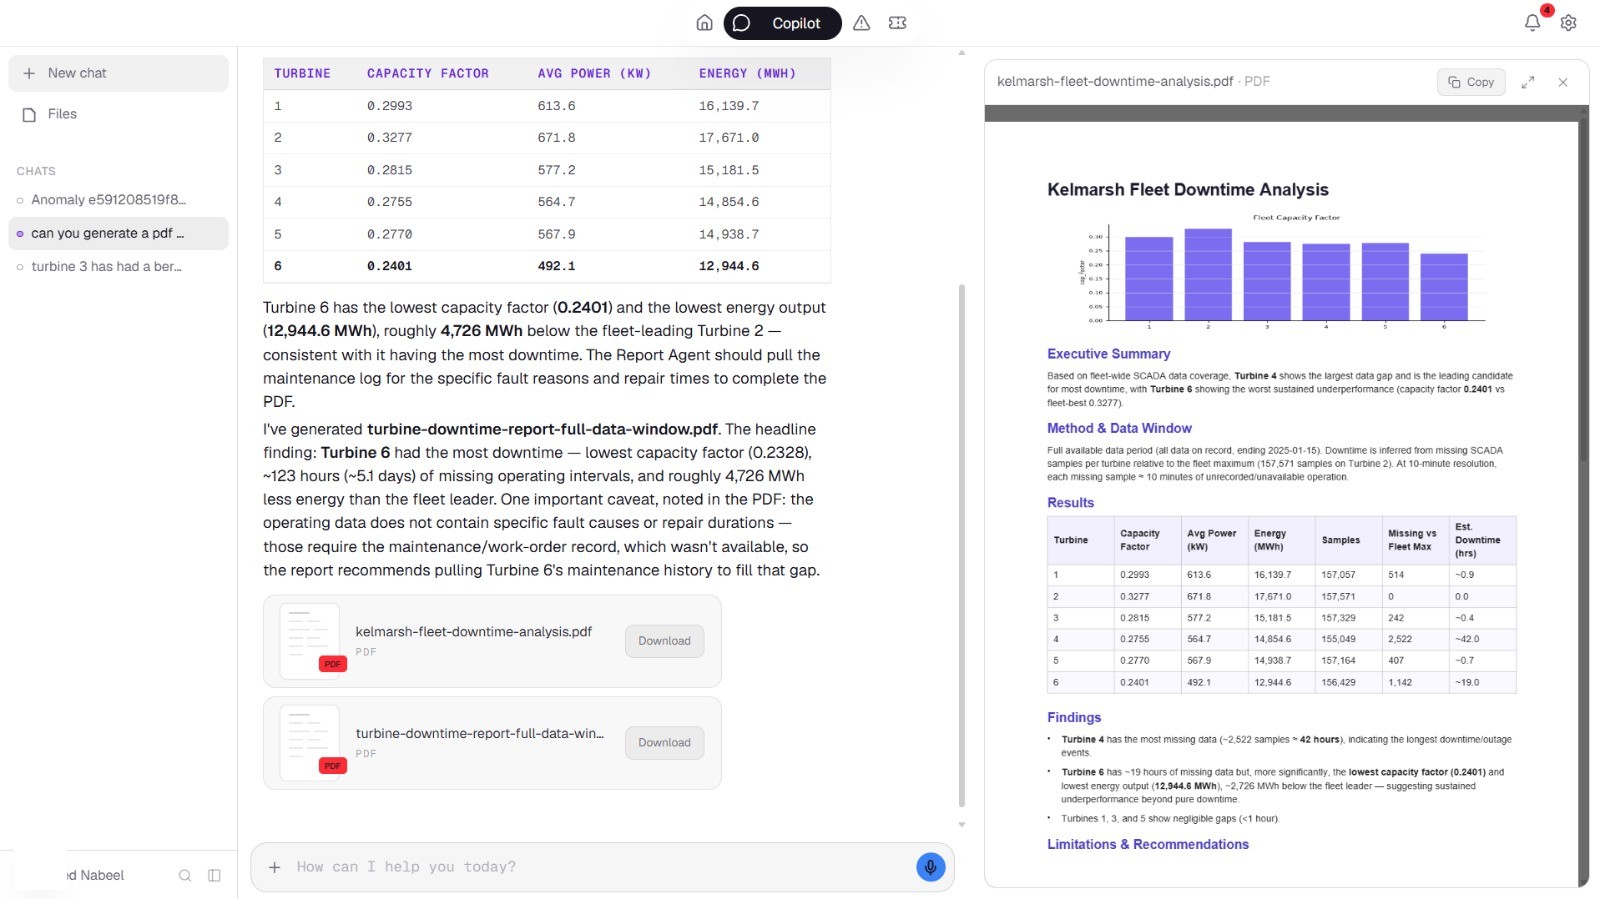
Prototype copilot answering a downtime question with a table and a generated PDF
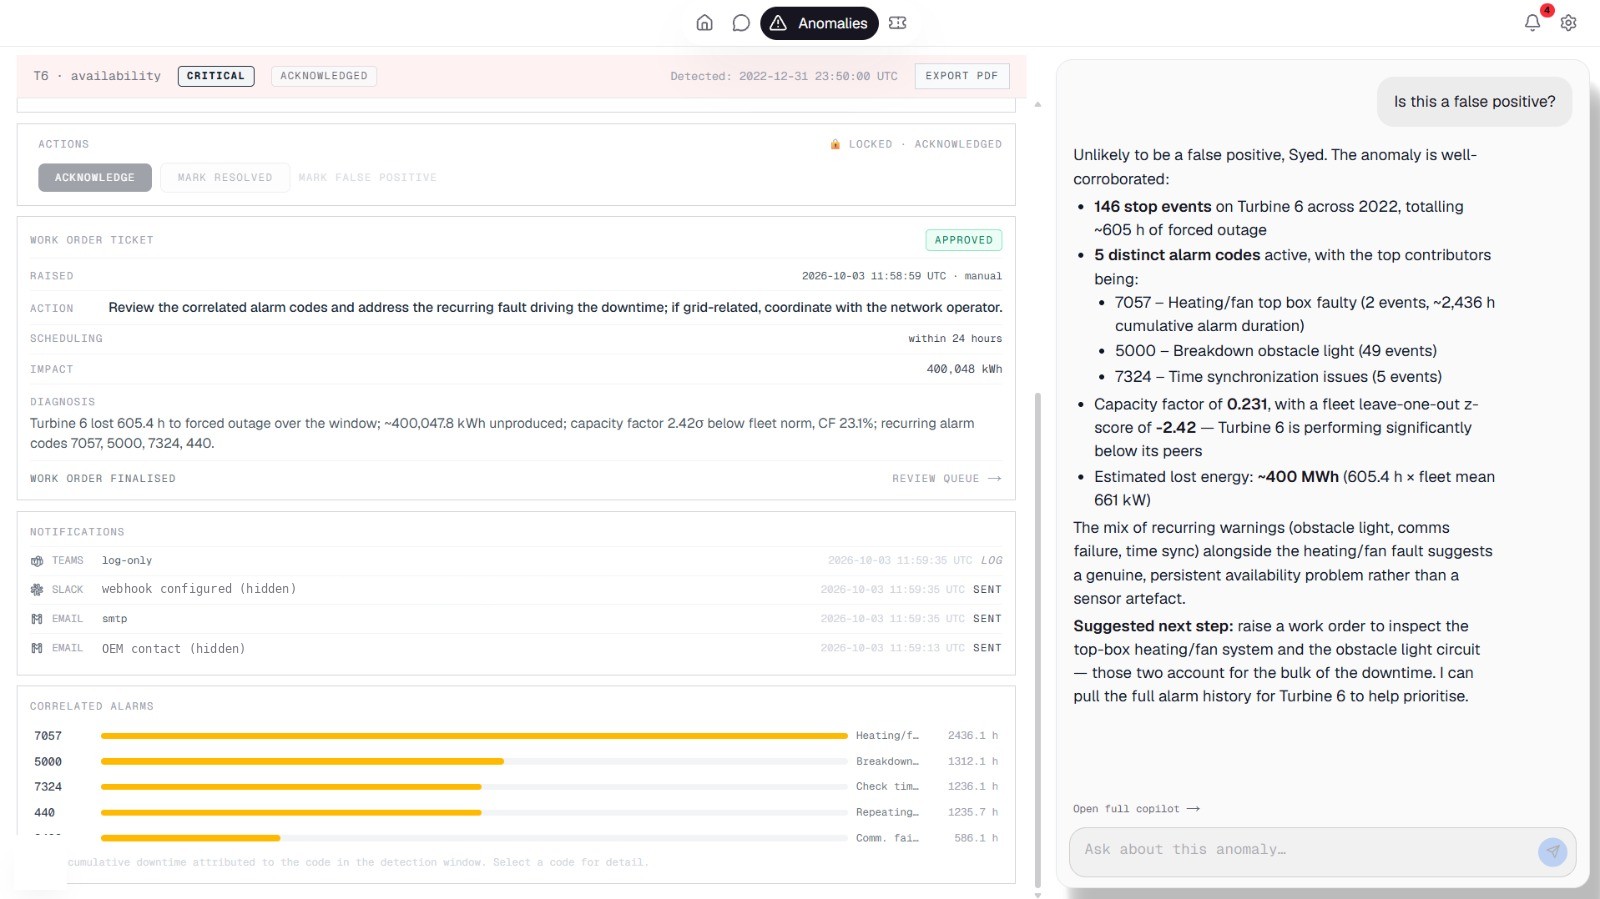
Prototype anomaly page with diagnosis, approved work order and notifications
Roadmap

Value in weeks, not years

Phase 1AI Operations Copilot1–2 monthsPlain-English answers in Teams. Automatic daily and weekly reports.
Phase 2Alarm intelligence2–4 monthsCorrelated alarms, probable root cause, estimated losses.
Phase 3Predictive maintenance4–8 monthsRisk trends from SCADA, better maintenance timing.
Phase 4Digital twin + agents6–12 monthsExpected versus actual, specialised agents working together.
Indicative durations from the original pitch. Each phase is reviewed before the next begins.
Guardrails

Engineers stay in control

01Read-only access by default
02A person approves every action
03No autonomous control of turbines

Every number traces back to its source data. Every action is logged with who approved it.

Deployment options

Three ways to run it.
One we recommend.

01 · Data never leaves site

On-premises

Everything runs in the company's own data centre.

Platform

On-site servers: web app, API, agents, PostgreSQL

AI model

Open-weight LLM on an on-site GPU server

Best when

Policy forbids any data leaving the network

Trade-off

GPU server to run; less capable models; Teams still needs Microsoft's cloud

02 · Data stays, AI hosted

Hybrid

Platform and data on site; only the AI model is in the cloud.

Platform

On-site servers and database

AI model

Azure OpenAI, minimised prompts, zero-retention terms

Best when

Telemetry must stay on site but a strong model is wanted

Trade-off

Company IT runs availability, backups and patching

03Recommended

Azure cloud +
edge collectors

Managed platform in Azure; a small collector at each plant.

Platform

Azure Kubernetes, managed PostgreSQL + pgvector

AI model

Azure OpenAI over a private endpoint

Plants

Edge collector per site, outbound-only over VPN or ExpressRoute

Why

The project's target design; native to Teams, SSO and Power BI; managed backups

All options · Read-only historian account · Outbound-only from plant OT · No inbound ports · SSO + MFA · A person approves every action

To confirm in discovery: Microsoft 365 / Azure use and data-residency policy. If plant data may not leave site, option 02 is the fallback.

The ask

Start with one visible win

Approve a Phase 1 pilot: an AI Operations Copilot on the existing SCADA and historian, with automated daily and weekly reports. Indicative 1–2 months.

  1. 01Nominate operations, engineering and IT leads
  2. 02Confirm data access and security
  3. 03Agree how the pilot will be judged
From dashboards to digital engineers.